I Measured My Local LLM 13 Times, and the Measurements Were Wrong 19 Times
Introduction
I rebuilt my local LLM setup on a Ryzen AI PC, measuring speed and quality and writing posts about it. Starting from the cleanup up to reading quality at 128K, that’s 13 posts.
When I reread them after finishing, I noticed an awful lot of moments where the measurement itself was wrong. I thought I was writing about models and settings, but what I’d actually written was mostly stories of failing at “how to measure”.
I counted 19. This time I line them all up and turn them into a checklist to look at before the next measurement. There are no new measurements in this post.
All 19
| # | Post | What happened | How I noticed |
|---|---|---|---|
| 1 | Cleanup | I deleted 69 GB, yet free space dropped by 150 GB. OneDrive was writing 6 GB a minute in the background | Impossible value |
| 2 | Build | In the speculative decoding comparison, the control’s startup timed out waiting for a download. Only one side’s numbers were left | Raw data |
| 3 | 〃 | I wrote “--cache-reuse works”, but it was disabled from the start. What worked was a different mechanism on by default | Log (later) |
| 4 | Benchmark noise | Comparing benchmarks from separate launches, I nearly reached the opposite conclusion, “q8_0 is faster”. Run-to-run variation was 10% | Impossible value |
| 5 | SVG figures | I assumed “figures shrink to 0.8×”. Measured, it was 1.06× on desktop and 0.41× on a narrow screen | Measured before writing |
| 6 | Three-AI review | The script tallying review hit rates looked for a nonexistent status, untriaged. The warning could never fire | AI review |
| 7 | thinking | I graded the whole response, which penalized only thinking ON with its many intermediate steps | Raw data |
| 8 | 〃 | \b53\b doesn’t match “53個”. .NET treats kanji as word characters | Impossible value |
| 9 | 128K | I almost wrote that theory and measurement “agreed within 3%”. I had mixed GiB and 10⁹ bytes. Aligned, they differ by 10% | Double-check |
| 10 | 〃 | During measurement, my own auto-start launched llama-server (26 GB) | Impossible value |
| 11 | 〃 | Even within one launch, conditions measured later were faster. A +16% difference became +6% when I swapped the order | Impossible value |
| 12 | 〃 | A run I judged “unaffected because it finished before the interruption” was actually an outlier (−24%; really −15%) | Doubted it later |
| 13 | 〃 | I estimated “reading 128K takes about 6 minutes”. It actually took 18–24 minutes | Double-check (against measurement) |
| 14 | 〃 | I worked backward from llama-bench run time assuming it was “proportional to repetitions” and manufactured a contradiction. It was actually proportional to the number of conditions | Double-check |
| 15 | Cache | A bug swallowed the result lines into a variable, so nothing was displayed | Raw data |
| 16 | 〃 | A mistake in passing arguments made the server fail to start all 3 times, and the run carried on to the end in an error state | Log |
| 17 | 〃 | The PC went into standby for 10 hours during measurement. I noticed when a 2.5-minute job showed a total time of 36,197 seconds | Impossible value |
| 18 | 〃 | The sleep-prevention script wasn’t doing anything because of a type conversion error | Error output |
| 19 | Reading 128K | max_tokens 64 was too short and cut the model off before it wrote the answer. Indistinguishable from a retrieval failure | Raw data |
I didn’t write about 15–18 in the posts. I fixed them where they didn’t affect the posts’ conclusions. But they’re the same kind of failure, “I thought I measured it but I hadn’t”, so I included them here.
Five Types
Lined up, the failures fall roughly into five types.
1. Comparing the Wrong Way (#2, #4, #11)
These are cases where the premise of the comparison had broken down.
- The control wasn’t captured (#2)
- Comparing things from separate launches (#4)
- Even within one launch, the order mattered (#11)
As the lesson from #4, I wrote “sweep conditions within a single launch”. Two posts later, I found that even then the order skews the results (#11). What I finally settled on was sandwiching the measurement as A → B → A and checking that the first and last A agree.
2. The Measuring Instrument Is Broken (#6, #7, #8, #9, #15, #19)
These are cases where the tools producing the numbers were wrong. This was the most common type.
The grading regexes (#7, #8), a tally script (#6), units (#9), output handling (#15), the limit passed to the model (#19). The tricky part with all of them is that the resulting numbers still look plausible.
I hit #19 after verifying the grader against 12 strings. The grader was right, but the answer had been cut off in the stage before the grader. The measuring instrument isn’t just the grader; it’s everything from input to tally.
3. Interrupted from Outside (#1, #10, #12, #17)
These are cases where something else was running in the middle of the measurement.
OneDrive (#1), my own auto-start (#10), something I wasn’t monitoring (#12), standby (#17). After #10 I added monitoring to watch for llama-server starting, but llama-server was all it watched (#12). In the end, I log the CPU and GPU used by anything other than llama every 10 seconds.
Even so, runs with no interruption at all still varied by 10–40% from each other. Watching everything doesn’t bring the variation to zero.
4. Not Checking Assumptions (#3, #5, #13, #14)
These are cases where I used “it should be like this” without checking.
- The setting I added should be enabled (#3)
- Figures should be shrinking (#5)
- The speed on short inputs should hold for long inputs (#13)
- Run time should be proportional to repetitions (#14)
#3 took 4 days to come to light. I connected “I added the setting → it got faster → thanks to that setting” and never read the one line in the startup log that said “will be disabled”.
5. Safety Mechanisms Not Working (#16, #18)
These are cases where the very mechanism meant to prevent failure was broken.
Sleep prevention (#18) said nothing while it wasn’t working. The wait for server startup (#16) kept waiting even when startup failed, then moved on to the next step. For both, the fix was making them stop when they fail. A safety mechanism is most dangerous when it fails silently.
How I Noticed
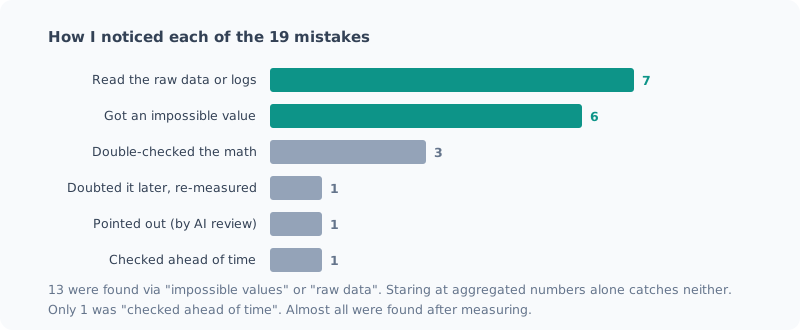
13 of the 19 were found through an “impossible value” or “raw data”.
Lined up, every example of an “impossible value” is something that physically can’t happen.
- Free space shrinks after deleting files (#1)
- KV quantization makes a difference at depth 0, where the KV cache is empty (#4)
- An empty KV is slower than one holding 30,000 tokens (#10)
- Speed at depth 0 rises in the order of execution (#11)
- A 2.5-minute job takes 10 hours in total (#17)
Put the other way around, mistakes that aren’t impossible don’t get caught here. The −24% in #12 was a value that seemed like “well, that can happen”, so I let it slide.
“Raw data” means the moments when I read the model’s output or the server’s log itself, not the aggregated numbers. In #7, reading an output marked wrong showed it had solved the problem correctly; in #19, the answer had been cut off partway. Had I looked only at the accuracy numbers, both would have ended as “the model got it wrong”.
Meanwhile, only 1 was found by checking ahead of time (#5). Before writing “it shrinks to 0.8×” in the post, I measured it just in case. Almost all the rest I found by measuring, thinking something was off, and going back.
Checklist Before Measuring
I turned the fixes from all 19 into something to look at before the next measurement.
Comparison
- Measure the same condition twice and learn the spread first. If a difference is smaller than that, don’t draw a conclusion
- Sweep the conditions being compared within one launch. Also sandwich them as A → B → A and check that the first and last A agree
- Before comparing, confirm that the control’s numbers were actually captured
Measuring instrument
- Test the grader on real strings for both whether it picks up correct answers and whether it rejects wrong ones
- Treat the stages before the grader (building the input, output limits, display) as part of the measuring instrument too
- Write the unit next to the number. Check that the two things being compared use the same unit
Interruptions
- List what might run during the measurement (auto-starts, sync, sleep)
- Log not just specific processes but the CPU and GPU used by everything else
Assumptions
- Check in the startup log that the settings you added are actually enabled
- Don’t extrapolate values measured on short inputs to long inputs. Measure at least once at the real length
Safety mechanisms
- Write prevention, waiting and monitoring mechanisms so that they stop when they fail
- After finishing, check that the safety mechanisms actually took effect
When looking at results
- First check whether any physically impossible values are mixed in
- For wrong answers and outliers, read the raw output
- The more interesting the first result, the more you should doubt it. Check what else that explanation predicts
Summary
- Across 13 posts, the measuring side was wrong 19 times
- Five types: comparison, measuring instrument, interruptions, assumptions, safety mechanisms. Measuring-instrument errors were the most common
- 13 of the 19 I noticed through impossible values or raw data. You won’t find them in the aggregated numbers alone
- Only 1 was found ahead of time. So decide in advance how you’ll doubt the results after measuring
I’ve been measuring how fast the model is and how well it reads, but looking back, what I came to understand best was how far I can trust my own way of measuring.
Related Posts
How to Benchmark a Local LLM (with a Checklist)
I put together the steps that make the results trustworthy when measuring the speed or quality of a local LLM. The same conditions vary by 10%, the order changes the result, background work causes 5x swings, and the grader is broken. This is a before, during and after checklist built from mistakes I actually made.
I Stretched the Context to 128K, and the Wall Was Waiting Time, Not Memory
I stretched my local LLM's context from 32K to 128K and measured it. The memory shortage I expected never happened, and the reason lay in the model's architecture. The wall I hit instead was prompt ingestion time: just reading 128K takes 21–24 minutes. It also covers how my own auto-start polluted the measurements along the way.
I Thought My Benchmark Found an Effect, but It Was Measurement Noise
When I tried to verify a settings decision I'd made earlier, I got the opposite result. Just as I was about to celebrate, I noticed something physically odd, measured again, and the original decision was right. This is about why you shouldn't compare benchmarks from separate launches.