Dropping an Unused Image Feature Saved 1 GiB of Memory and Didn't Change Speed
Introduction
In the prompt cache post, I spotted this line in the server’s startup log.
srv load_model: cache_reuse is not supported by multimodal, it will be disabledThe model I use, Qwen3.6-35B-A3B, can also handle images.
When you specify it with -hf, the image mmproj (a file of about 0.9 GB) is loaded automatically.
But neither the llm command nor the dev-orchestra reviews use anything but text.
So every time, I was reading a file and spending memory on a feature I never use.
What changes if I drop it? I had three candidates.
- Memory goes down (almost certain)
- Startup gets faster (one less file to read)
- Loading and generation get faster (it might be the cause of the roughly 20% speed gap between llama-bench and the real server)
If the third one hit, my daily llm would get faster as it is.
Designing from the Checklist
In my previous post, I turned 19 measurement mistakes into a checklist. This time I applied it from the start.
| Checklist item | What I did this time |
|---|---|
| Is the setting really in effect? | Check that the mmproj loading line does not appear in the startup log, and stop if it differs from what I expect |
| How to compare | Alternate with → without → with → without → with, 5 runs. Use whether the first and last “with” runs match to see drift |
| Same conditions as production | Same arguments as serve.ps1 (-c 65536, MTP on). The only difference is --no-mmproj |
| Interference | Record CPU and GPU used by anything other than llama every 10 seconds |
| Safety stops | Stop if sleep prevention doesn’t work. Stop if the server doesn’t start |
| Raw data | Record the beginning of the generated text, and check both conditions produce sane output |
The first item comes from the lesson of the --cache-reuse episode.
I was wrong for four days because I assumed “the setting I added must be working”, so now if it isn’t in effect, the measurement itself stops.
I measured startup time, memory, time to load 32K tokens, and generation speed (256 tokens × 3 runs).
Results of the First Run
| # | mmproj | Startup | Memory (after startup) | Generation (avg) | Loading 32K |
|---|---|---|---|---|---|
| 1 | with | 9.7 s | 25.11 GiB | 18.00 t/s | 140.4 s |
| 2 | without | 8.3 s | 24.12 GiB | 19.13 t/s | 133.6 s |
| 3 | with | 9.4 s | 25.21 GiB | 18.42 t/s | 144.9 s |
| 4 | without | 9.6 s | 24.12 GiB | 17.25 t/s | 134.9 s |
| 5 | with | 10.1 s | 25.21 GiB | 19.22 t/s | 125.5 s |
Memory Clearly Dropped by 1 GiB
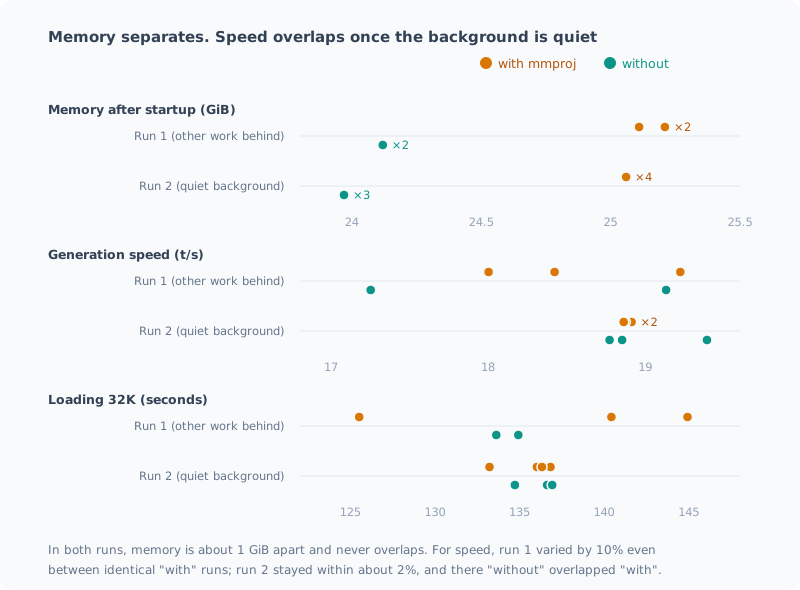
“With” was 25.11–25.21 GiB, and “without” was 24.12 GiB both times. The difference is about 1.0 GiB. The values barely moved across the 5 runs, and the two ranges don’t overlap. This I can state with confidence.
On Speed, I Couldn’t Say Anything
Speed, on the other hand, shows no clear direction in the table. For generation, the first “without” run is fast and the second is slow. For loading, “without” lands somewhere in the middle.
The deciding factor was that the first and last “with” runs didn’t match.
| #1 (with) | #5 (with) | Drift | |
|---|---|---|---|
| Loading 32K | 140.4 s | 125.5 s | −11% |
| Generation | 18.00 t/s | 19.22 t/s | +7% |
Same conditions, yet the numbers moved by 10% between the start and end of the measurement. The “without” value of 134 seconds sits right inside the spread among the “with” runs (loading 125–145 seconds).
The drift during measurement was larger than the difference between conditions. In this state, I can say neither “it got faster” nor “it didn’t change”. You could also say that interleaving the runs is what showed me this. If I had compared one run each, I might have put #4 and #5 side by side and written “it’s faster with mmproj”.
What the Monitoring Caught
Looking at the monitoring log, CPU use by things other than llama rose to 13–22% between 16:14 and 16:20. The top processes were python3.13 and StreamDeck. python3.13 is not the measurement script.
When I looked into it, the Python on this PC is the Microsoft Store version 3.13, and its process name shows up as python3.13.
And during the same period, another Claude session was working with dev-orchestra.
dev-orchestra is a tool that runs on this Python. I believe that’s what was running in the background
(I didn’t check the other session’s logs, so this is a judgment from the circumstances).
That window covers the end of #3 and #4. The low generation speed in #4 (17.25 t/s) might be due to it. But #1 and #5, which don’t overlap that window, also drift by 10%, so I can’t say this was the only cause of the drift.
Stopping the Background Work and Measuring Again
I added “check that no other Claude session is running” to the “Interference” item of the checklist, and measured again.
When I checked before starting, the last activity in the dev-orchestra session was 40 seconds ago. It really was in use. I had that session stopped, confirmed there were no python processes, and then started.
I also increased the number of runs: alternating with → without 7 times (4 with, 3 without). That way I can compare each “without” run with the average of the “with” runs before and after it. Even if things drift slowly during measurement, bracketing them before and after cancels it out.
| # | mmproj | Startup | Memory (after startup) | Generation (avg) | Loading 32K |
|---|---|---|---|---|---|
| 1 | with | 25.0 s * | 25.06 GiB | 18.91 t/s | 133.2 s |
| 2 | without | 8.3 s | 23.97 GiB | 19.39 t/s | 136.6 s |
| 3 | with | 8.0 s | 25.06 GiB | 18.87 t/s | 136.0 s |
| 4 | without | 7.1 s | 23.97 GiB | 18.77 t/s | 134.7 s |
| 5 | with | 8.1 s | 25.06 GiB | 18.91 t/s | 136.8 s |
| 6 | without | 7.3 s | 23.97 GiB | 18.85 t/s | 136.9 s |
| 7 | with | 7.8 s | 25.06 GiB | 18.86 t/s | 136.3 s |
* #1 was started right after stopping the server that had been running until just before.
In the monitoring, CPU use by things other than llama had a median of 7.1%, with no sustained peak like in the first run.
The drift shrank from 10% to around 2%.
| Generation | Loading 32K | |
|---|---|---|
| First and last “with” (#1 and #7) | −0.2% | +2.3% |
| #2 (without) vs. the “with” runs around it | +2.6% | +1.5% |
| #4 (without) vs. the “with” runs around it | −0.6% | −1.2% |
| #6 (without) vs. the “with” runs around it | −0.2% | +0.3% |
The difference between “without” and the “with” runs around it changes direction from run to run and stays within 3%. I think it’s fair to say dropping mmproj doesn’t change speed. More precisely, if there is a difference, it’s under 3%.
Memory was again the same in all 7 runs (with: 25.06 GiB, without: 23.97 GiB, a difference of 1.09 GiB).
I don’t know whether the 10% drift in the first run was entirely due to dev-orchestra, because it drifted between #1 and #5 too, which didn’t overlap that window. But it’s certain that just quieting the background cut the spread of the same script to one fifth.
The Output Is Identical, Word for Word
In all 12 runs across the two measurements, the generated text was the same from the start.
ローカルLLMをiGPU(統合グラフィックス)で動作させる最大の利点は、専用メモリ(VRAM)を必要とせず、…mmproj is the part that reads images, so as expected it has no effect on text only. Still, checking whether things really are as expected is how I did it this time.
The Two Things I Hoped For Didn’t Pan Out
--cache-reuse still couldn’t be used after dropping it.
srv load_model: cache_reuse is not supported by this context, it will be disabledThe reason just changes from “because it’s multimodal” to “not supported in this context”. This model is a hybrid with SSM, and it can’t coexist with a mechanism that shifts and reuses the KV. It was just as I confirmed last time.
The speed gap between llama-bench and the real server couldn’t be explained by mmproj either. If loading had become 20% faster, that would have been the answer, but the remeasured difference is under 3%. The cause remains unknown.
I Changed the Default
I made “without mmproj” the default.
| With | Without | |
|---|---|---|
| Memory | about 25.1 GiB | about 24.0 GiB |
| Startup | about 8 s | about 7–8 s |
| Text output | — | Same |
| Image input | Available | Not available |
The only thing I lose is image input, which I don’t use now. On a machine with 93.6 GiB, 1 GiB is a small difference. Still, there’s no reason to keep spending memory on a feature I don’t use.
I added -Vision to serve.ps1, so images are loaded only when I need them.
# 普段(llm の自動起動もこちら)
pwsh -File scripts\serve.ps1            # --no-mmproj が付く

# 画像を使うとき
llm -Stop
pwsh -File scripts\serve.ps1 -Vision    # mmproj を読み込む
After the change, I had llm start the server automatically and confirmed that it came up with --no-mmproj, returned a response,
and that memory was at 24.27 GiB.
Summary
- I only use text, yet the image mmproj was loaded every time
- Dropping it reduces memory by about 1 GiB. All 12 runs across the two measurements showed nearly the same value, so I can state this with confidence
- In the first run, the first and last runs of the same condition drifted by 10%, and I couldn’t say anything about speed
- In the background, another Claude session was running dev-orchestra. After stopping it and measuring again, the drift shrank to around 2%
- The remeasured speed difference is under 3%. Dropping mmproj makes things neither faster nor slower
--cache-reusestill couldn’t be used after dropping it, and mmproj wasn’t the cause of the speed gap with llama-bench either- I changed the default to no mmproj. When I need images, I use
-Vision
I started measuring hoping for a speedup, but speed didn’t change, and what I actually gained was 1 GiB of memory.
That I could write “I don’t know” after the first run, and say “it doesn’t change” after the second, is because I measured with interleaved runs and watched the size of the drift. And what cut the drift to one fifth wasn’t the measurement method but quieting the background.
Related Posts
Can It Really Read All the Way into a 128K Document?
I had a local LLM read a 128K-token document and measured whether it could pick up facts planted in 20 places. Nothing was missed because of depth, and for things not in the document it answered "not stated". The only mistake was mixing up a different ID that shared its first two characters, and it went away when I renamed one of them.
Can a 128K Document Be Reused Without Reading It Again?
Having a local LLM read a 128K-token document takes over 20 minutes. To see whether later requests can be faster, I measured the prompt cache in 6 scenarios. Changing just the question takes seconds, but saving to disk and restarting means re-reading everything. The reason lies in the model's hybrid architecture. I also found a mistake in an earlier post.
I Stretched the Context to 128K, and the Wall Was Waiting Time, Not Memory
I stretched my local LLM's context from 32K to 128K and measured it. The memory shortage I expected never happened, and the reason lay in the model's architecture. The wall I hit instead was prompt ingestion time: just reading 128K takes 21–24 minutes. It also covers how my own auto-start polluted the measurements along the way.