Introduction
Every summer, the news is full of “heavy rain somewhere,” “an earthquake somewhere,” and “heatstroke alerts.” Yet I couldn’t find a service that lets you check, all in one place, where in Japan is the most dangerous right now.
I thought it would be handy to see weather, earthquakes, air quality, and heat waves on a single screen, so I built JAPAN RISK MAP.
What I Built
JAPAN RISK MAP is a web app that calculates a risk score for all 47 prefectures in real time and shows them as a ranking plus a map.
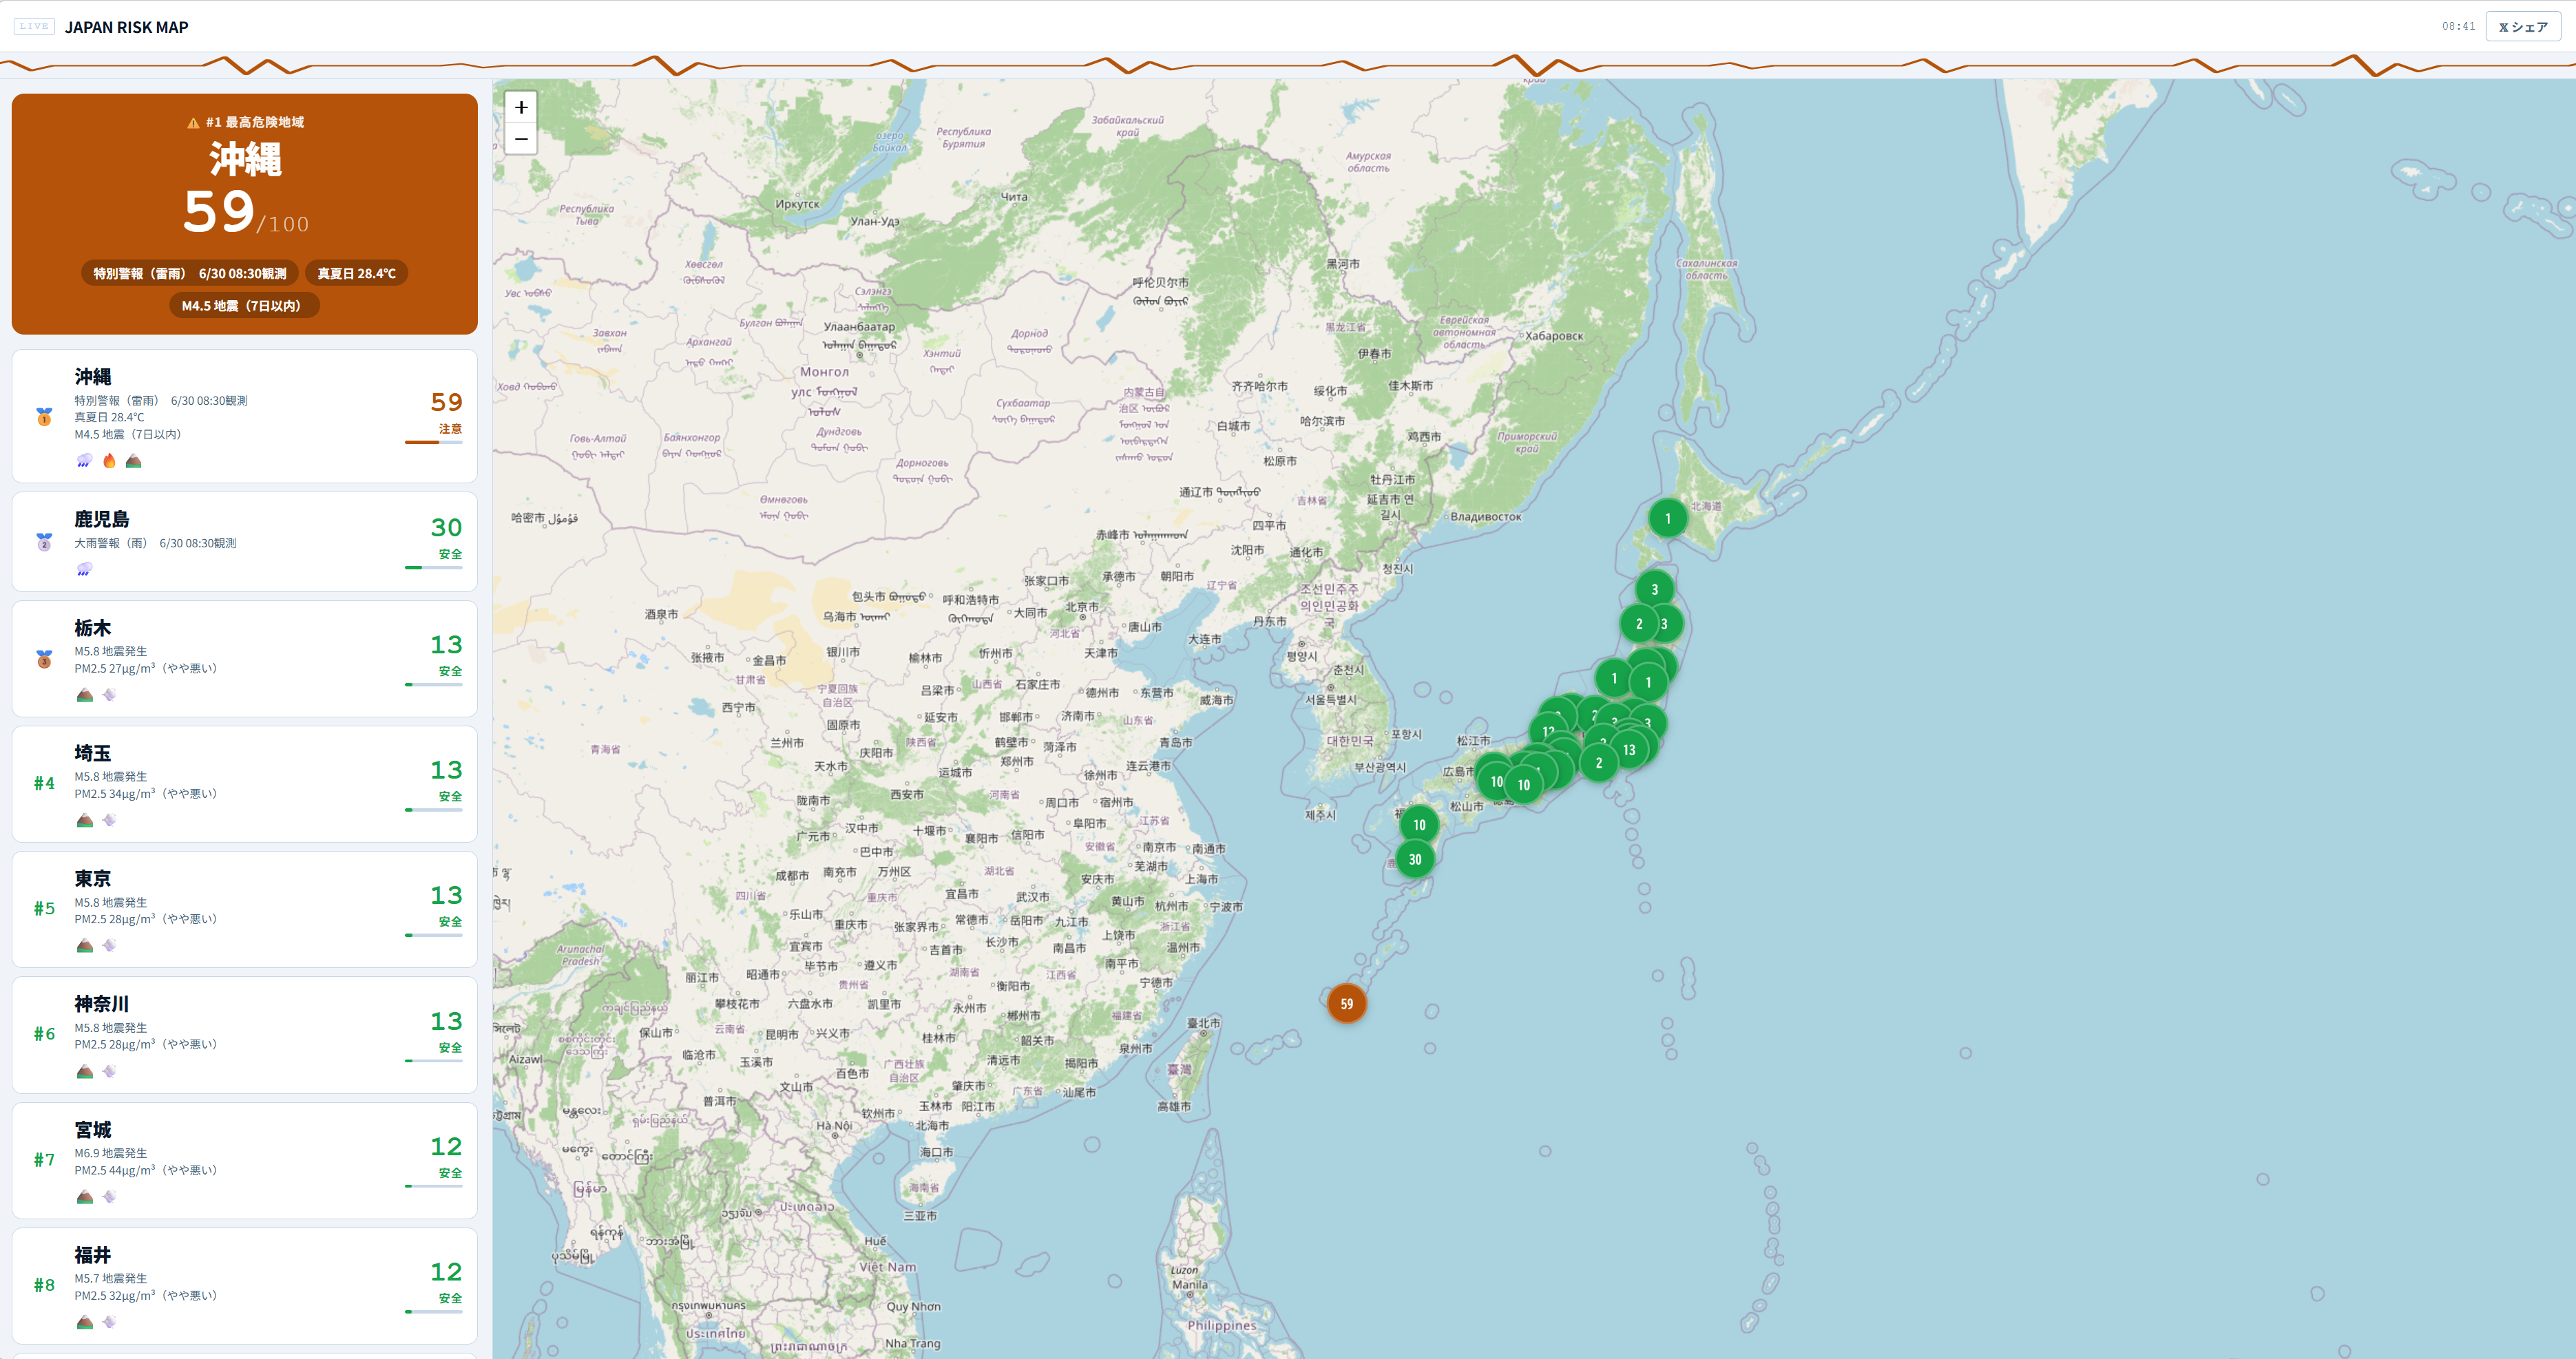
The data updates automatically every 5 minutes, so if you leave the page open, you always see the latest situation.
Data It Collects
It combines data from four categories to calculate a risk score for each prefecture.
| Category | Main contents |
|---|---|
| Weather | Heavy rain, storms, lightning, advisories, warnings |
| Earthquakes | Seismic intensity, frequency |
| Air quality | PM2.5, yellow dust, photochemical smog |
| Heat waves | Heatstroke alerts, WBGT values |
Screen Layout
Map View
It shows a map of Japan colored by prefecture. The higher the score, the redder the color, and the lower, the closer to green, so you can see at a glance where the risk is concentrated geographically.
Ranking View
A list of prefectures in order from the highest risk. You can check the exact scores and ranks as numbers, so you can also see small differences that are hard to read from the map.
Auto Refresh
Weather and earthquake conditions change from moment to moment. It refreshes automatically every 5 minutes, so you can follow changes just by keeping the page open.
Building It
The hardest part was fetching and combining multiple external data sources in real time. Each source updates on its own schedule, so getting the timing of the score calculation right took some work.
Defining the “risk score” itself also took trial and error. The weight of weather warnings, how to convert seismic intensity, the reference values for PM2.5: simply adding the numbers together doesn’t match reality in some cases, so I keep adjusting it.
Summary
- Calculates a risk score that combines four categories: weather, earthquakes, air quality, and heat waves
- Shows the 47 prefectures as a ranking plus a map in real time
- Updates automatically every 5 minutes, so you can leave it open and see the latest situation
- Useful when you want to see at a glance “where in Japan is the most dangerous today”
Related Posts
I Measured dev-orchestra: Time per Request, and Findings by Number of Reviewers
With dev-orchestra 1.2.1, I made one small feature request and measured how long it took (about 6 minutes, not counting my approval) and how many findings were reported and accepted with 1, 2, and 4 reviewers. More reviewers meant more accepted findings, but the extra ones were about tests.
Giving dev-orchestra Standing Instructions per Role
I tried instructions, added in dev-orchestra 1.2.1. Standing instructions for the implementer or reviewers written in the repository go into every prompt. I check, with real output, how they are shown, where they go, and how a change to the instructions is treated.
[Released] dev-orchestra: Parallel Work Units and Per-Role Instructions v1.1.0 - v1.2.1
A roundup of dev-orchestra's changes from v1.1.0 to v1.2.1: running a plan as work units side by side, standing instructions per role, questions before the design, and settings for progress reports. If you capture its output on Windows, note the encoding change.